
The Most Stable Industrial
Real Estate Asset in Mexico
End-to-End Industrial Project Development in Mexico
Why Invest in Industrial Buildings?
Investing in industrial buildings is one of the most stable models in today’s real estate market. The logic is simple:
You purchase an industrial building → it is leased to a company → you receive monthly income.
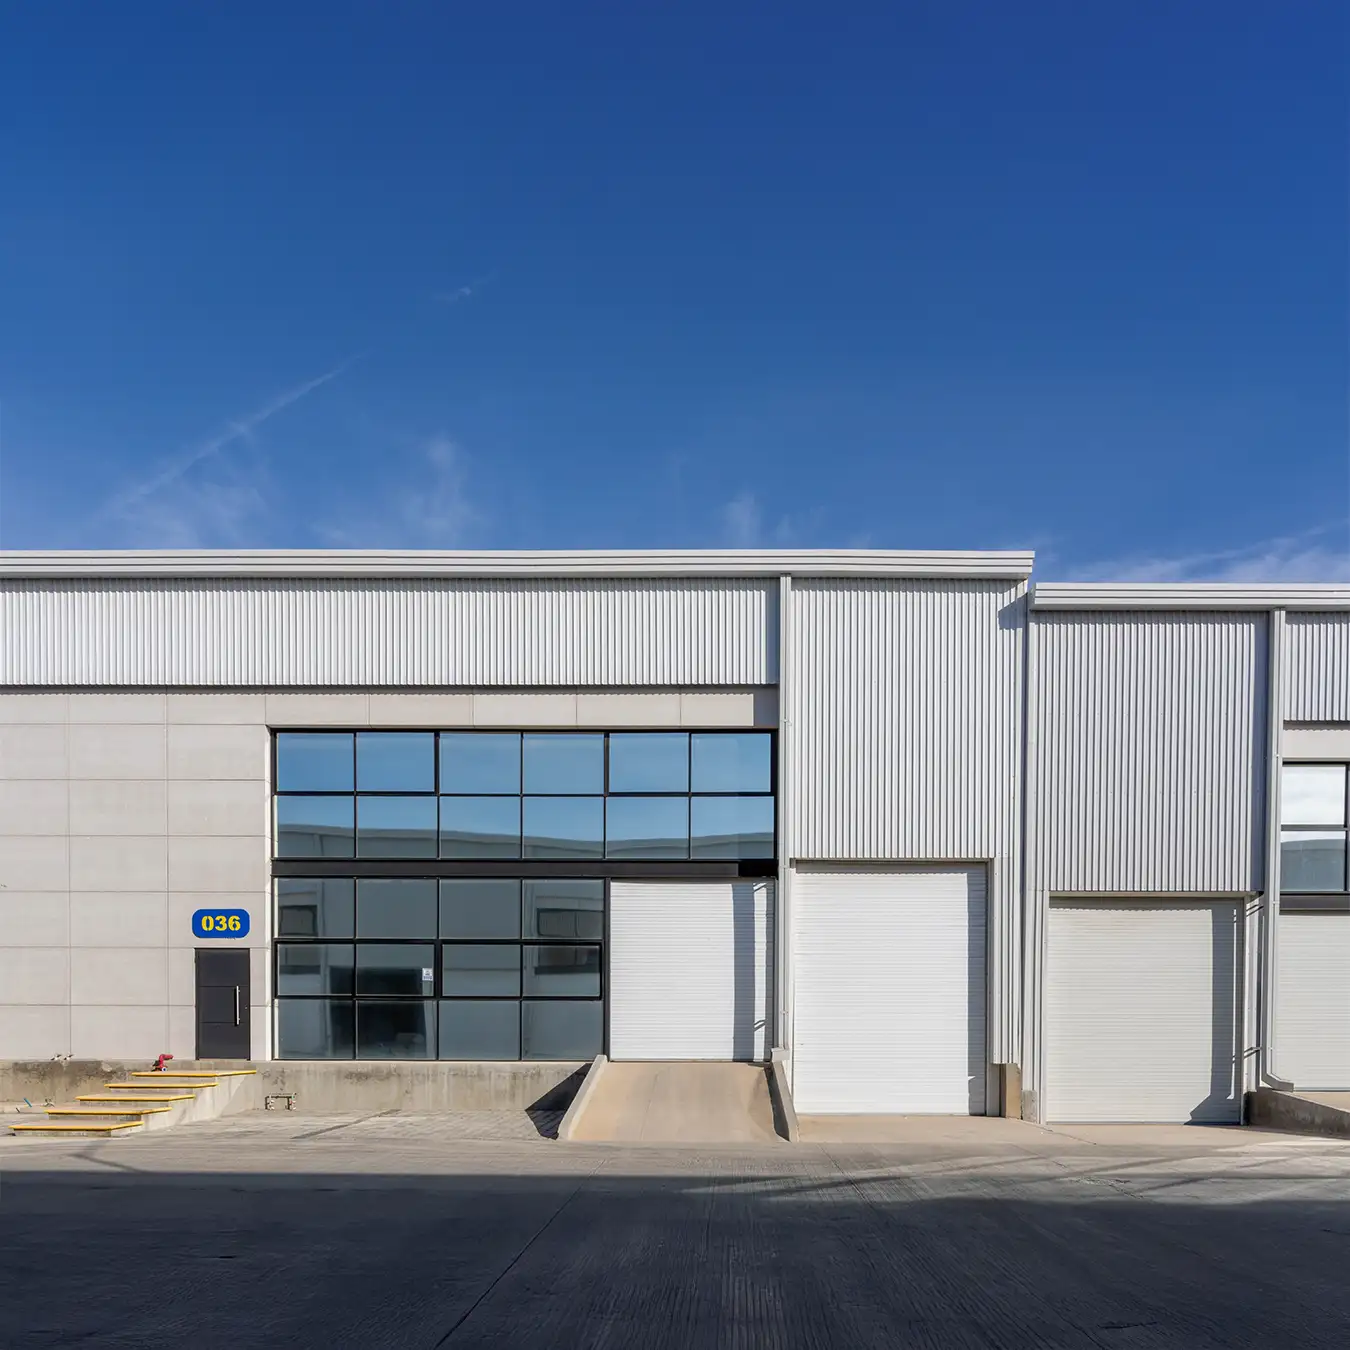
Industrial Building Construction
Por qué este activo sostiene su rentabilidad
01
High demand driven by logistics and nearshoring
02
Long-term lease agreements
03
AAA tenants
04
Low maintenance costs
01
Project Selection
Strategic locations with strong logistics demand along key industrial corridors.
02
Development Structuring
Efficient design focused on profitability and industrial operations.
03
Specialized Construction
CAPEX and delivery timeline control under technical standards.
04
Asset Commercialization
Leasing to national and international companies.
05
Rental Stabilization
Signed lease agreements and the generation of consistent cash flow.
06
Asset Management and Monitoring
Asset optimization and long-term value preservation.

Industrial Market Indicators in Mexico
Real data supporting the sector’s profitability and stability.
0%
Average CAP Rate
Estimated annual return of 9.58%
0%
Vacancy Rate
There is limited available space. The best-planned projects are the first to be leased.
0
Paying More for Rent?
The average of $7.16 USD/m² is not an overprice; it reflects the cost of operational efficiency and strategic location.
0
Industrial Footprint in Mexico
Demand is real and structural, driven by e-commerce and light manufacturing.
Data as of Q2 2026
2017-2026
Evolución de M2 construidos
2017: 25,745 m²
2018: 38,256 m²
2019: 58,102 m²
2020: 97,719 m²
2021: 108,747 m²
2022: 92,566 m²
2023: 116,239 m²
2024: 96,250 m²
2025: 70,736 m²
2026: 84,000 m²
Industries Driving Demand in Jalisco
Logística — 34%
Manufactura — 26%
Electrónica — 18%
Alimentos — 12%
Plásticos — 10%